Quality Control of Assembly File
Overview
After genome assembly, we need to assess whether the assembled genome is good enough for downstream analysis.
In this lesson, we will check assembly quality using three tools:
QUASTto calculate assembly statisticsCheckM2to estimate genome completeness and contaminationseqkitto filter out short contigs
Learning objectives
By the end of this lesson, you should be able to:
- explain key assembly quality metrics
- run
QUASTon an assembly file - interpret number of contigs, N50, L50, GC%, and total length
- run
CheckM2to estimate completeness and contamination - remove contigs smaller than 500 bp using
seqkit - compare assembly quality before and after filtering
Activate the assembly environment
If you are continuing from the previous lesson, you may already be in the assembly environment.
If not, activate it first:
conda activate assemblyCheck that the required tools are available:
quast --versionQUAST V5.3.0checkm2 --version1.1.0seqkit versionseqkit V2.13.0Input file
In the previous lesson, we copied the final SPAdes assembly file into the assemblies folder.
The input assembly file for this lesson is:
assemblies/S1_contigs.fastaCheck that the file exists:
ls assembliesYou should see:
S1_contigs.fastaIn this lesson, we will use:
assemblies/S1_contigs.fastaas the main assembly file.
What is assembly quality control?
Assembly quality control helps us answer whether the assembled genome is suitable for further analysis.
Important questions include:
- How many contigs are present?
- What is the total assembly length?
- Is the GC content reasonable for the organism?
- Is the assembly fragmented?
- Is the genome mostly complete?
- Is there evidence of contamination?
Important assembly QC metrics
| Metric | Meaning |
|---|---|
| Number of contigs | Total number of assembled sequences |
| Total length | Total size of all contigs combined |
| N50 | Contig length where 50% of the assembly is in contigs of this length or longer |
| L50 | Number of contigs needed to cover 50% of the assembly |
| GC% | Percentage of G and C bases in the assembly |
| Completeness | Estimated proportion of expected genome content present |
| Contamination | Estimated proportion of extra or contaminating genome content |
A good bacterial assembly usually has:
- reasonable total genome length for the species
- low number of contigs
- high N50
- high completeness
- low contamination
However, interpretation depends on the organism, sequencing quality, and analysis goal.
Run QUAST
To calculate assembly statistics, run QUAST.
Create an output folder and run QUAST:
mkdir -p quastquast \
-o quast/S1_original \
-t 4 \
assemblies/S1_contigs.fastaUnderstanding the QUAST command
| Option | Meaning |
|---|---|
quast |
Runs the QUAST tool |
-o quast/S1_original |
Output folder |
-t 4 |
Use 4 CPU threads |
assemblies/S1_contigs.fasta |
Input assembly file |
Check QUAST outputs
List the QUAST output directory:
ls quast/S1_originalYou should see files such as:
report.html
report.pdf
report.tsv
report.txt
transposed_report.tsv
The most useful files are:
| File | Description |
|---|---|
report.html |
Interactive HTML report |
report.txt |
Text summary |
report.tsv |
Tab-separated report |
transposed_report.tsv |
Table format useful for comparison |
View QUAST summary in terminal
To quickly view the text report:
cat quast/S1_original/report.txtYou can also view the transposed table:
cat quast/S1_original/transposed_report.tsvLook at the QUAST report and record:
- number of contigs
- total length
- GC%
- N50
- L50
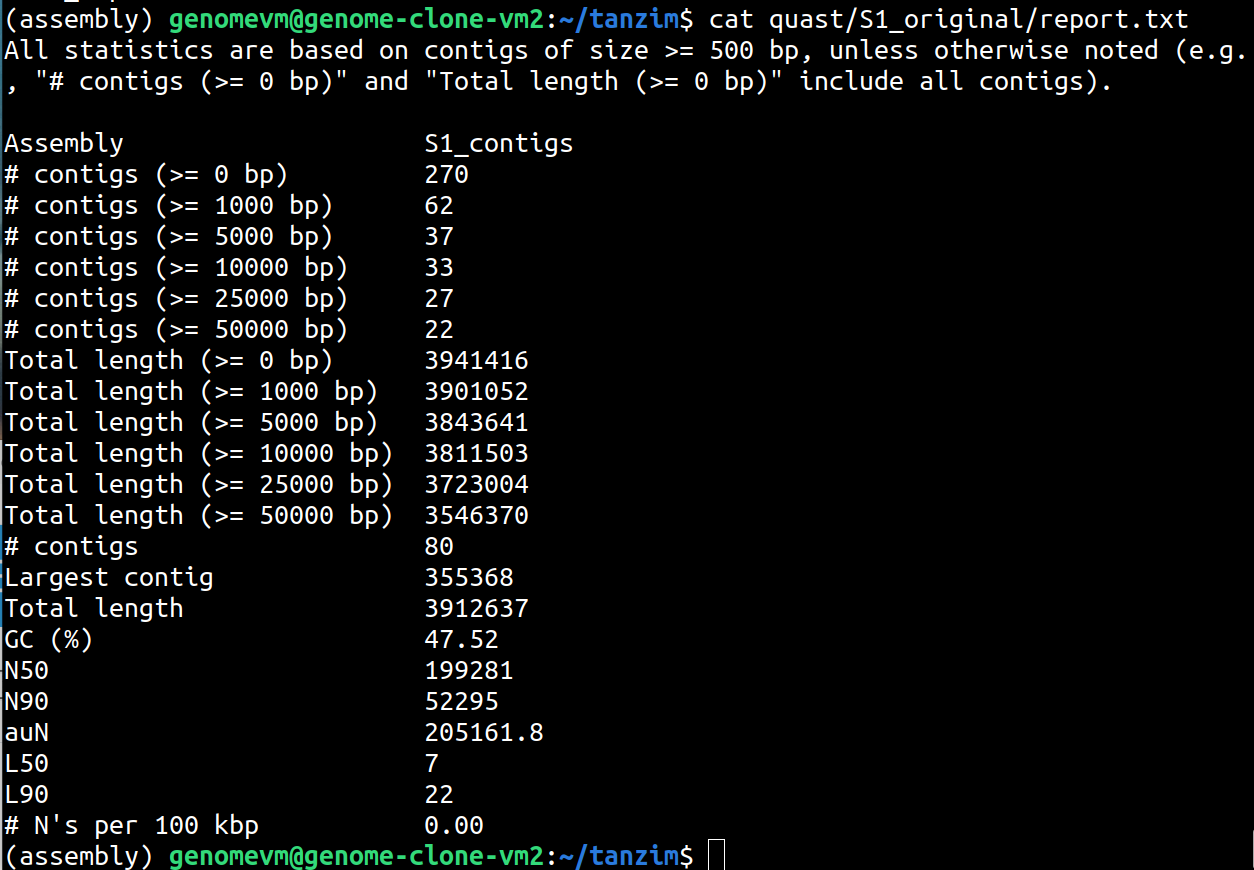
- number of contigs
270 - total length (>=0 bp)
3941416 - GC%
47.52% - N50
199281 - L50
7
Number of contigs 270 indicates all contigs, however, # contigs 80 indicates contigs greater than 500 bp. It is important that we only retain contigs greater than 500 bp as a standard bioinformatics procedure
Open report.html manually from File Explorer.
Use:
open report.htmlUse:
xdg-open report.htmlRun CheckM2
CheckM2 estimates genome completeness and contamination.
Create an output folder and run CheckM2:
mkdir -p checkm2checkm2 predict \
--threads 4 \
-x .fasta \
--input assemblies/S1_contigs.fasta \
--output-directory checkm2/S1_originalUnderstanding the CheckM2 command
| Option | Meaning |
|---|---|
checkm2 predict |
Runs CheckM2 prediction |
--threads 4 |
Use 4 CPU threads |
-x .fasta |
Input file extension |
--input assemblies/S1_contigs.fasta |
Input assembly file |
--output-directory checkm2/S1_original |
Output folder |
Check CheckM2 outputs
List the output directory:
ls checkm2/S1_originalCheckM2 usually creates a quality report file. View the result:
cat checkm2/S1_original/quality_report.tsvLook at the CheckM2 output and record:
- completeness
- contamination
The exact values depend on your assembly. They are usually found in:
- completeness
100.0 - contamination
0.01
Compare QUAST and CheckM2 results
QUAST and CheckM2 answer different questions.
| Tool | Main purpose | Example outputs |
|---|---|---|
QUAST |
Assembly statistics | contigs, N50, L50, GC%, total length |
CheckM2 |
Genome quality estimation | completeness and contamination |
Can you compare the results from QUAST and CheckM2?
What does each tool tell you about the assembly?
QUAST tells us about the structure of the assembly, such as the number of contigs, N50, L50, GC%, and total length.
CheckM2 tells us about the biological quality of the genome, especially estimated completeness and contamination.
Both are needed because an assembly can have good contiguity but still be incomplete or contaminated.
Why filter short contigs?
For public genome submission or journal-supported analysis, it is common practice to remove very short contigs. Short contigs may represent low-confidence assembly fragments or noise.
In this lesson, we will remove contigs shorter than 500 bp.
Why might we remove contigs smaller than 500 bp before reporting or submitting an assembly?
Very short contigs may be unreliable, poorly supported, or less useful for downstream interpretation. Removing them can make the assembly cleaner and more suitable for reporting.
Filter contigs smaller than 500 bp
Use seqkit to keep only contigs that are at least 500 bp long. Let’s check the manual of seqkit first.
seqkit --helpNow run seqkit:
seqkit seq \
  -m 500 \
  assemblies/S1_contigs.fasta \
  > assemblies/S1_contigs_filtered.fasta
Understanding the seqkit command
| Option | Meaning |
|---|---|
seqkit seq |
Runs sequence filtering |
-m 500 |
Keep sequences with minimum length 500 bp |
assemblies/S1_contigs.fasta |
Input assembly |
> |
Redirect output to a new file |
assemblies/S1_contigs_filtered.fasta |
Filtered assembly file |
Check that the filtered file was created:
ls assembliesYou should see:
S1_contigs.fasta
S1_contigs_filtered.fasta
Count contigs before and after filtering
Count contigs in the original assembly:
grep -c "^>" assemblies/S1_contigs.fasta270Count contigs in the filtered assembly:
grep -c "^>" assemblies/S1_contigs_filtered.fasta80How many contigs were removed after filtering contigs smaller than 500 bp?
Subtract the number of filtered contigs from the number of original contigs.
For example:
Original contigs - Filtered contigs = Removed contigsRun QUAST on filtered assembly
Now run QUAST again on the filtered assembly.
quast \
  -o quast/S1_filtered \
  -t 4 \
  assemblies/S1_contigs_filtered.fasta
Check the output:
ls quast/S1_filteredView the summary:
cat quast/S1_filtered/report.txtFocus on:
- number of contigs
- total length (>=0 bp)
- GC%
- N50
- L50
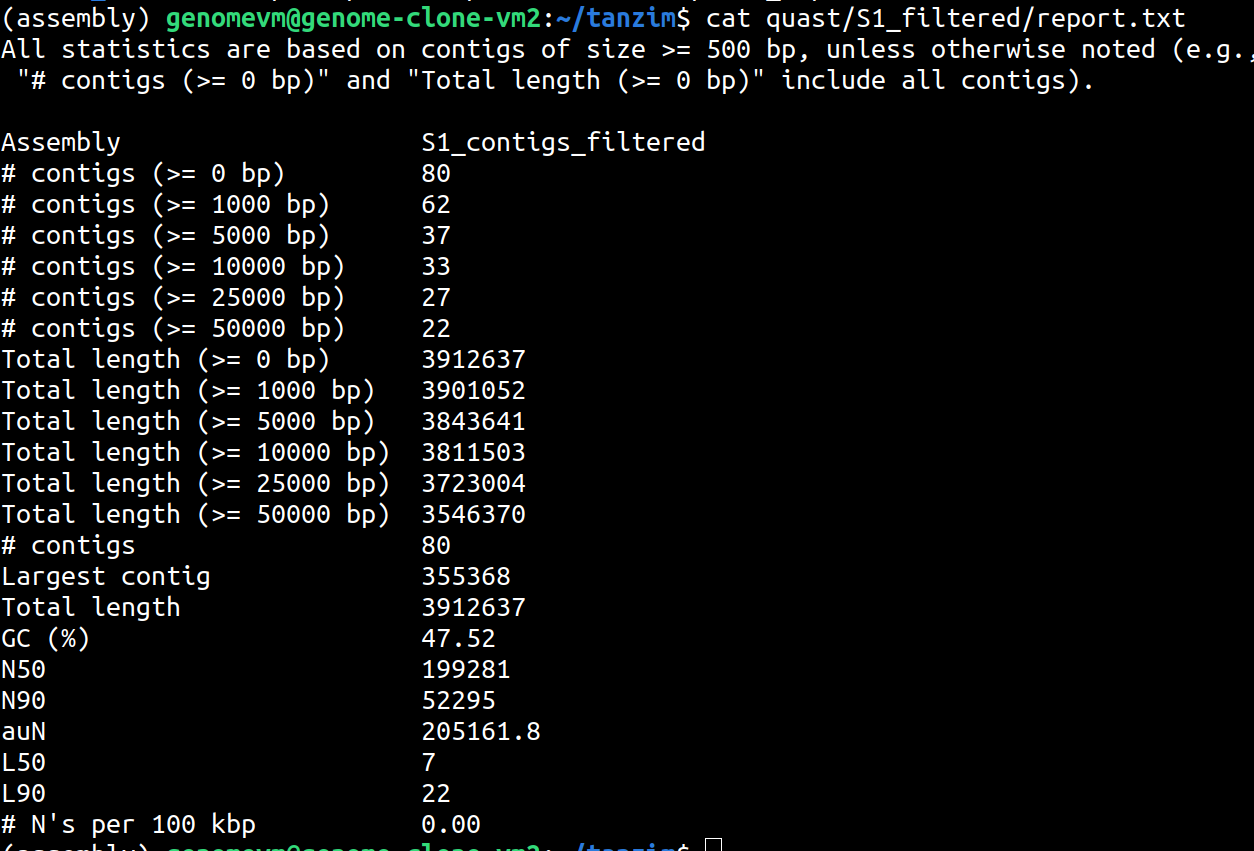
Compare original and filtered QUAST reports
You can compare the two QUAST reports manually:
cat quast/S1_original/report.txt
cat quast/S1_filtered/report.txtWhat changed after removing contigs smaller than 500 bp?
After filtering, the number of contigs usually decreases. The total assembly length may also decrease slightly. N50 and L50 may change depending on how many short contigs were removed.
Run CheckM2 on filtered assembly, view the result and compare with the original assembly CheckM2 report
Create a small table in your notes with the following columns:
| Assembly | Number of contigs | Total length (>=0 bp) | N50 | L50 | GC% | Completeness | Contamination |
|---|---|---|---|---|---|---|---|
| Original assembly | |||||||
| Filtered assembly |
Fill in the values from QUAST and CheckM2.
Run CheckM2 on filtered assembly
checkm2 predict \
  --threads 4 \
  -x .fasta \
  --input assemblies/S1_contigs_filtered.fasta \
  --output-directory checkm2/S1_filtered
View the result:
cat checkm2/S1_filtered/quality_report.tsv| Assembly | Number of contigs | Total length (>=0 bp) | N50 | L50 | GC% | Completeness | Contamination |
|---|---|---|---|---|---|---|---|
| Original assembly | 270 | 3941416 | 199281 | 7 | 47.52 | 100.0 | 0.01 |
| Filtered assembly | 80 | 3912637 | 199281 | 7 | 47.52 | 100.0 | 0.01 |
Did completeness or contamination change after filtering?
Small changes may occur after filtering. If only very short contigs were removed, completeness may remain similar. If important genomic content was present in short contigs, completeness may decrease slightly.
Organize assembly QC results
Your working directory should now contain:
assemblies
quast
checkm2
Check the directory structure:
lsCheck the assembly files:
ls assembliesCheck QUAST results:
ls quastCheck CheckM2 results:
ls checkm2Final directory structure
At the end of this lesson, your directory should look like this:
.
├── assemblies
│   ├── S1_contigs.fasta
│   └── S1_contigs_filtered.fasta
├── quast
│   ├── S1_original
│   │   ├── report.html
│   │   ├── report.txt
│   │   └── transposed_report.tsv
│   └── S1_filtered
│       ├── report.html
│       ├── report.txt
│       └── transposed_report.tsv
└── checkm2
    ├── S1_original
    │   └── quality_report.tsv
    └── S1_filtered
        └── quality_report.tsv
Key points
QUASTreports assembly statistics such as number of contigs, N50, L50, GC%, and total length.CheckM2estimates genome completeness and contamination.seqkitcan remove short contigs from an assembly file.- Filtering contigs smaller than 500 bp may reduce the number of contigs and slightly change total assembly length.
- Always compare assembly quality before and after filtering.
Next step
In the next lesson, we will use the cleaned assembly file for downstream genomic analysis.